Nothing you type here leaves your browser.
The formulas
Labor cost = wages × (1 + payroll taxes and benefits %)
Labor cost percentage = labor cost ÷ sales × 100
Sales per labor hour = sales ÷ hours worked
Labor you can afford = sales × your goal %
What to enter
Wages. All hourly wages for the period, including overtime. Add salaries for anyone who works in the business, if you want the full picture. Many owners leave out their own pay, and that makes the number look better than it is.
Payroll taxes and benefits. A percentage on top of wages, covering employer taxes, workers' compensation and any benefits. If you don't know your number, ask your accountant. Use the same figure each time, so the trend means something.
Sales. Use sales for exactly the same days as the wages. Take out sales tax and tips.
Hours worked. Actual hours from time cards, not scheduled ones.
Your labor goal. The percentage you're aiming for.
Reading the result
In the example already filled in, a business spends $4,200 on wages, with 12% on top. That's $4,704, and it's 31.4% of $15,000 in sales. With a 28% goal, it could spend $4,200 in total. So it's over by a bit more than $500 for the period, even though $4,200 happens to match its wages. The goal covers everything, including the extra costs, and that's easy to forget.
Where should your number be?
There's no single right answer, since it depends so much on your business. A service business that sells labor will run far higher than a shop that sells products. Compare yourself with your own best weeks, when service was good and the team wasn't run ragged. Our guide to labor cost percentage goes deeper.
Look at it by the day, if you can. A good weekly number can hide a Tuesday that loses money every week.
Turn it into a schedule
Once you have a sales per labor hour target, planning gets simple. If your target is $60 and you expect $3,000 in sales on Saturday, you can schedule 50 hours. If you've scheduled 62, cut 12 hours from the slowest times, or stagger a start or two.
Use it before the week happens
A calculator tells you what already happened. It's more useful to see this number while you can still do something about it.
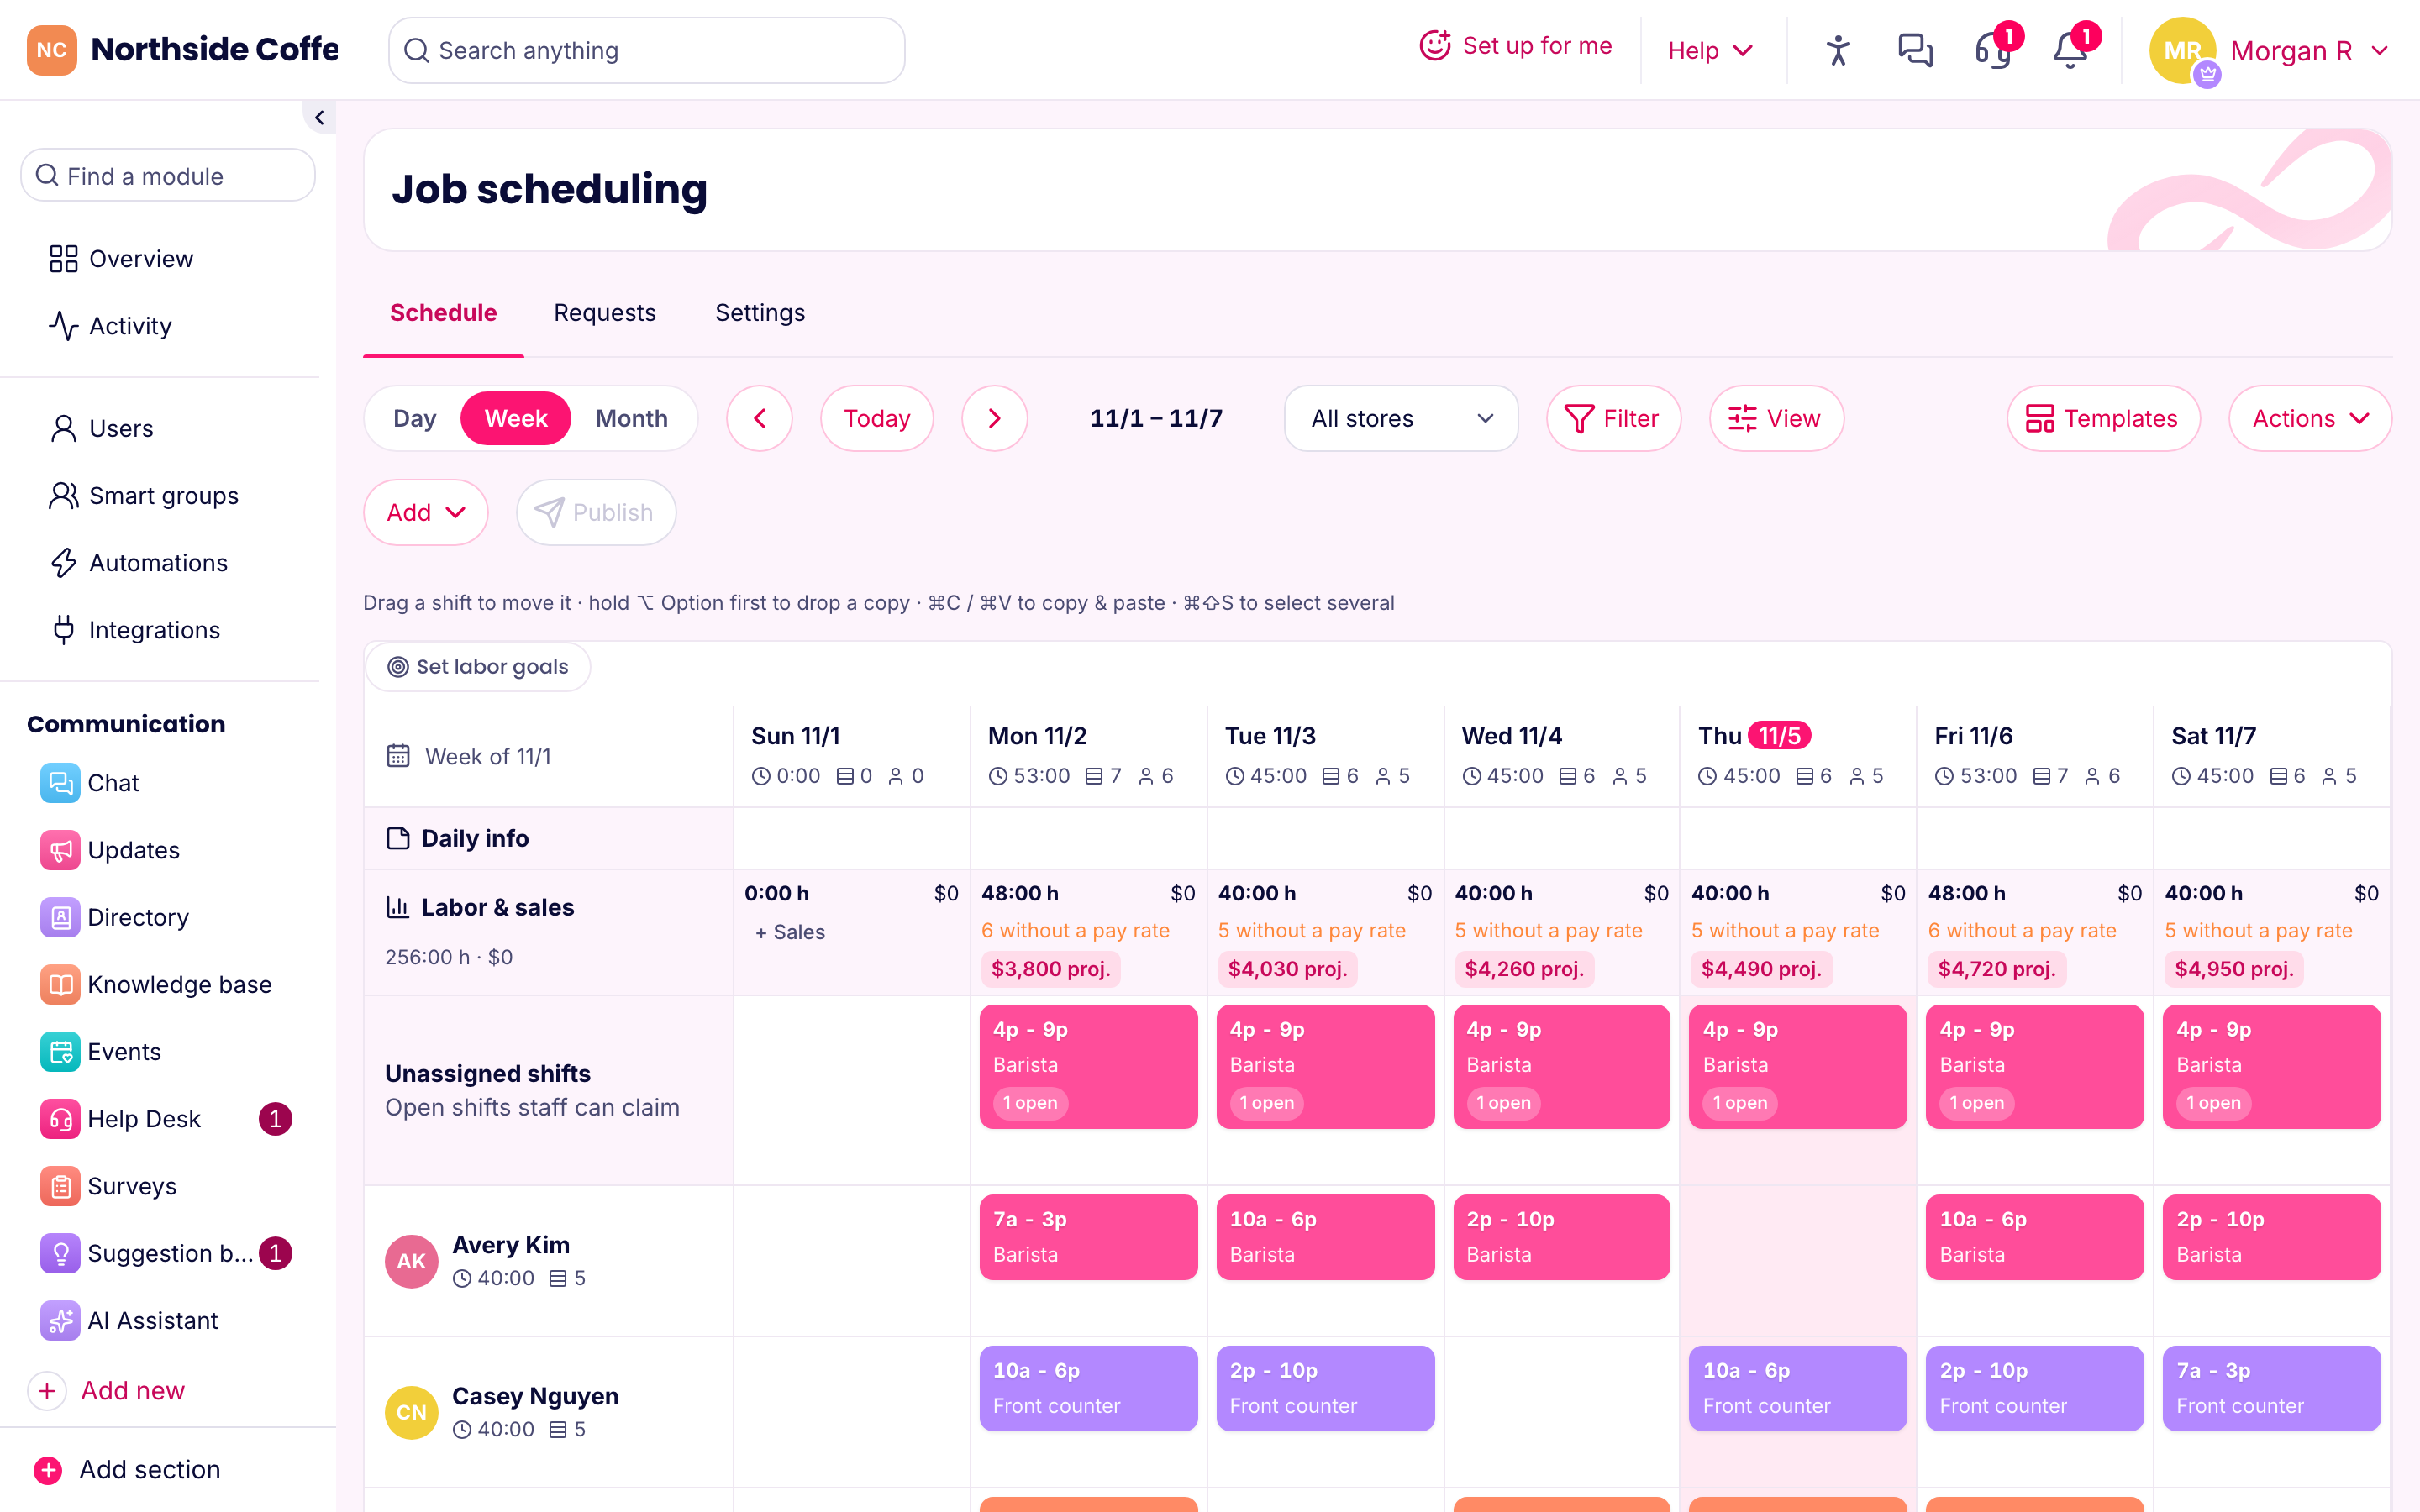
In PinkLinq, the schedule shows hours and labor cost next to your sales for each day. Type in projected sales, or let the forecast fill them in from your last four weeks. Set a goal as a percentage or as sales per labor hour. Days over the goal turn red, and each day suggests how many hours its sales can carry.